What Food Equity Looks Like in Your Neighborhood
Partnership for a Healthier America has launched its Food Equity Opportunity Map in partnership with the University of Maryland Baltimore County, highlighting where improving access to good food would make the greatest impact and allowing everyone to see what Food Equity looks like in their community for the first time.
At PHA, we’re working hand-in-hand with communities around the country every day to improve Food Equity: access to food that is affordable, sustainable, nutritious, high-quality, and familiar. Food is the number one driver of good health, and in too many places, good food is either too expensive, too far away…or both.
Together, we can build community health through improving Food Equity, but only if we first understand where that work is most needed. That’s why we launched the Food Equity Opportunity Map.
How did we decide where opportunities to improve Food Equity are?
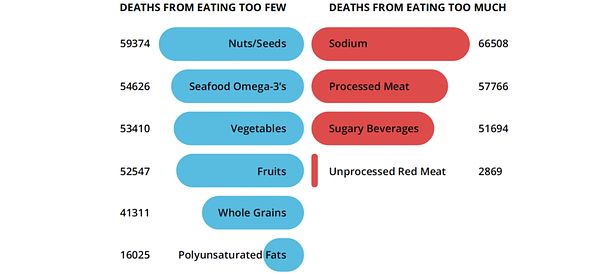
Ten foods — eating too much or too little — are at the root of nearly half of U.S. deaths from heart disease, stroke, and Type-II diabetes each year.*
So, when we were looking for places with the greatest opportunity to improve Food Equity - and places where Food Equity exists - we focused on places where access to the foods that build health are, and where they aren’t. We also looked at whether or not good food was affordable based on the income level of the community. Lastly, we looked at rates of Type-II Diabetes: a preventable, diet-related disease linked directly to food. This allows us to see places where good food is being consumed, regardless of whether it is accessible and affordable.
The combination of those 3 factors - adjusting for geography and population - shows us on a community-by-community level where we should focus our efforts. Let’s take a closer look at each of the factors that goes into the map:
Access to good food - the USDA Food Research Atlas is a national mapping tool that highlights areas where families have low access to food. “Low food access” is defined as a percentage of families that live more than 1 mile from a food store in urban areas or more than 10 miles in rural areas. We updated this data to use the 2020 Census tract information, as the USDA is currently using the 2010 Census information.
Ability to afford good food - even if a family lives near a food store, they still might not be able to afford the good food. To understand this, we took a look at poverty data on a Census tract level. The greater percentage of families in a community living at or below the poverty line, the more Food Equity work is needed.
Consumption of good food - just because families can access and afford good food, doesn’t mean they’re eating it. Rates of Type-II Diabetes give us an indication of places where good food is underconsumed.
Population and geography - access to food looks different in rural and urban communities, and there are some places where too few people live to accurately assess Food Equity. We took those factors into consideration when building the map.
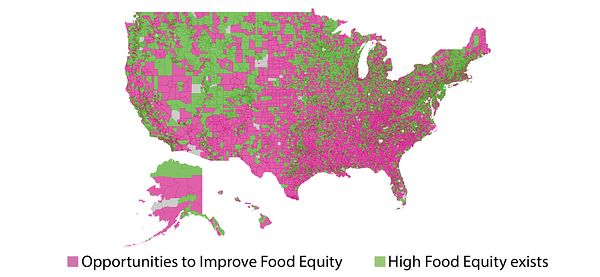
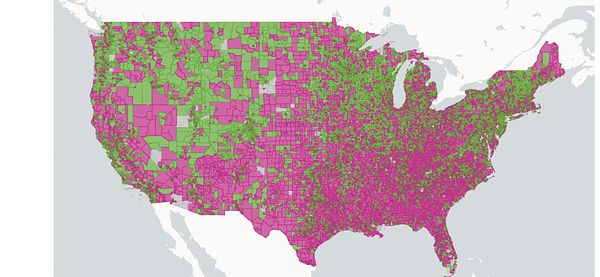
Working with the University of Maryland Baltimore County team, we were able to combine those three data points across the country on a Census-tract-by-Census-tract level. The tracts that were in the highest 40% of tracts across the country are indicated in green, and the other 60% of the tracts are places where improvement is needed and are indicated in purple.
Will this map change over time?
Absolutely. This is just the first version of the Food Equity Opportunity Map, and at PHA, we know there are many factors that go into good food access. We will be updating the map with more data and information in the future. Here are just a few things that we’re planning to add in the future:
Food Equity Bright Spots - there are many places where amazing work is happening to catalyze change to the food system. Future versions of the map will include stories of change.
PHA partners - we have over 490 partners around the country working to improve Food Equity. We’ll add those partners onto the map.
Food purchasing habits - we hope to include more information about food purchasing behavior in future versions of the map. This will help us understand consumption patterns at a deeper level.
Transportation - one of the key factors affecting food accessibility is the ability to get to food stores. Families living in communities that have limited public transportation face greater challenges. We plan to include public transportation data in future versions of the map.
If you have ideas or thoughts on other information you’d like to see on the Food Equity Opportunity map, please let us know. We’re working to consistently improve the map.
How can we improve Food Equity in a community?
Partnership for a Healthier America is working to improve Food Equity in communities around the country on a daily basis. Through programs like Good Food for All, our work with food banks through Healthy Hunger Relief and our work to raise the next generation of adventurous eaters through Veggies Early & Often, we can improve long-lasting and affordable access to good food. But, we cannot work together with communities without your support.
Our work on this map, and Food Equity is just beginning. We hope you’ll take some time to explore the Food Equity Opportunity Map, and to see what it looks like in your neighborhood.
*Micha, R., Peñalvo, J. L., Cudhea, F., Imamura, F., Rehm, C. D., & Mozaffarian, D. (2017). Association Between Dietary Factors and Mortality From Heart Disease, Stroke, and Type-II Diabetes in the United States. JAMA, 317(9), 912–924. https://doi.org/10.1001/jama.2017.0947

100 Million Servings
We've committed to adding 100 million additional servings of produce to the marketplace.
Learn More